现代数字助听器特性测试的新方法:函数分析法
Percentile Analysis – a new method for hearing aid assessment
Nikolai Bisgaard
在过去40多年里,助听器特性测试的标准一直采用国际电工委员会(ICE-International Electrotechnical Commission)的IEC 118-X和美国国家标准学会(American National Standards Institute, ANSI)的ANSI S3.22。该标准主要利用纯音在助听器工作时对各项指标进行测试,每次在极短的时间内测试一个频率,其测试结果的价值可以反映助听器的基本性能,特别是针对模拟技术的助听器。随着数字助听器的出现,助听器的各种复杂数字技术如数字反馈,放大与压缩,噪音抑制和方向性技术以成为现代助听器的基本配置,这样使助听器用户能够更好的处理各种复杂的声音环境。但是,传统IEC 118-X 或ANSI S3.22标准的不能够反映出现代数字助听器的技术和特征,自2004年,欧洲助听器厂家协会European Hearing Instrument Manufacturers Association (EHIMA)开始开发一个更适合现代数字助听器的助听器特性测试新标准,该项目称为现代数字助听器特性测试的国际标准ISMADHA (International Standard for Measurement of Advanced Digital Hearing Aids),该项目组主要进行了三方面的工作:开发一种新的言语刺激信号;一系列标准化的听力曲线图;新的助听器特性测试程序,并命名为函数分析法,项目组把结果于2008年提交给负责助听器特性测试的国际电工委员会技术委员会TC29和工作组WG13,该工作于2011年得到认可和批准,并定义为现代数字助听器特性测试的国际新标准IEC 118-15. 最终标准将于2012年公布。本杂志将系列登载该标准的内容及以上三方面的具体工作。
Background
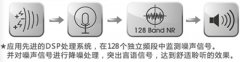
For the past 40 years the measurement standards for hearing aids (IEC 60118-x and ANSI S3.22) have predominantly been based on swept pure tones as the test signal to excite the hearing aid. Such measurements are valuable in many ways, but they also have serious shortcomings. The pure tone measurements are well suited to show the features of analogue hearing aids and have been updated on several occasions. But since 1996 a dramatic increase of signal processing complexity has occurred following the introduction of DSP hearing aids. Modern hearing aids based on digital signal processing perform very sophisticated signal processing in order to provide the best possible amplification of the ambient sounds surrounding the hearing aid users. They typically apply multiband compressors that process all information in parallel. Although multiband compressors were introduced by ReSound as early as in 1989, digital signal processing has enabled a significant development in complexity with regards to the number of bands, interaction between bands and other types of sophistication.
For the past 40 years the measurement standards for hearing aids (IEC 60118-x and ANSI S3.22) have predominantly been based on swept pure tones as the test signal to excite the hearing aid. Such measurements are valuable in many ways, but they also have serious shortcomings. The pure tone measurements are well suited to show the features of analogue hearing aids and have been updated on several occasions. But since 1996 a dramatic increase of signal processing complexity has occurred following the introduction of DSP hearing aids. Modern hearing aids based on digital signal processing perform very sophisticated signal processing in order to provide the best possible amplification of the ambient sounds surrounding the hearing aid users. They typically apply multiband compressors that process all information in parallel. Although multiband compressors were introduced by ReSound as early as in 1989, digital signal processing has enabled a significant development in complexity with regards to the number of bands, interaction between bands and other types of sophistication.
The classic measurement standards (IEC 60118-x and ANSI S3.22) for hearing aids operate generally with pure-tone stimuli. This means that the hearing aid - in contrast to real- life situations - is only excited at one frequency at the time and only for a very short duration. Very little useful information on the signal processing performance itself can be derived from such measurements. Several attempts to use broad band stimuli in order to excite the hearing aids more properly have been made. They include IEC 60118-2 and ANSI S3.42. Such methods were a step in the right direction and although they gained some acceptance they still suffered from shortcomings related to the nature of the test signals. In order to create meaningful measurements with the puretone based measurement methods many hearing aid manufacturers offers a special ”test setting” that essentially turns off all sophisticated features and reduces the hearing aid to a linear hearing aid. This is done to avoid the confusion that may arise when small differences between equipment and test set-ups result in large deviation between data sheets and sample measurements.
The existing measurement standards are basically only documenting the electro-acoustic properties of the devices. For quality control purposes, such electro-acoustic measurements make good sense and certainly still have value. When a hearing aid malfunctions it is typically one of the transducer components that fails or has deteriorated due to aging, debris, mechanical shock etc. This is effectively detected by plain electro-acoustic testing.
The ISMADHA initiative
In 2004 the European Hearing Instrument Manufacturers Association (EHIMA) decided to start a project for the development of a new measurement procedure that would provide a much more appropriate test-method suitable for modern digital hearing aids. The introduction of Digital signal processing has made it possible to develop numerous signal processing algorithms that improve the performance of hearing aids. Examples are:
•Advanced Multiband Compression
•Digital Feedback Suppression
•Adaptive Directional microphone systems
•Noise Reduction by spectral subtraction
•Environmental program switching
It is often seen that standardization work is lagging a bit behind the most advanced development. A certain level of know-how and experience is required to develop a measurement procedure that can be generally acknowledged and therefore standardized. The subject of the procedure should also be a product feature that is offered by most manufacturers and that is generally appreciated. Speech amplification is a fundamental task for a hearing aid and multiple systems with different characteristics are offered on the market today. Current measurement standards offer little relevant information on the detailed behavior of the different systems available. The pure-tone measurements can provide data on attack and release times as well as compression ratios, but in most cases it is quite difficult to understand how these data can be used by the people fitting the hearing aids to understand how a complex signal such as speech is processed. A hearing aid with a high compression ratio and long time constants, for instance does not provide much syllabic compression, but rather acts an automatic volume control that doesn’t alter the dynamic relationship between the speech components.
A working group was then formed and the project was named ISMADHA (International Standard for Measurement of Advanced Digital Hearing Aids) and it was chosen to focus on Speech Amplification as the subject for this new measurement standard. From the outset it was the ambition to create a truly international standard that would be broadly accepted and members of the working group were recruited from both industry and academia, hearing aid manufacturers and measurement equipment suppliers and from many different countries.
It was the clear intention to develop a standard that could be used to characterize the speech amplification of a hearing aid as closely as possible to the way it would be experienced by the hearing aid user. This requirement had quite far-reaching consequences: It was soon realized that no standardized speech testing signal was available at the time. Several quasi-speech signals were used in different contexts such as speech-shaped noise, ICRA noise and others, but none of them had all the properties of natural speech. It was therefore decided to create a new test signal that was international and highly speech like. The new test signal was called ISTS and will be explained in detail in a subsequent article.
Another requirement was to do away with the special test mode. Modern hearing aids depend upon fitting software for adjusting the devices to fit the hearing loss of the user. A new measurement standard must therefore include the fitting software. It was decided to use the standard fitting software supplied by the manufacturer as the basis, but since measurement standard require a well defined test setting in order to make reproducible measurements, there was a need for a well defined setting. The solution to this requirement was to develop a set of standardized audiograms that should be used to program the hearing aid. In order to secure that any type of hearing aid could be tested meaningfully, these standard audiograms had to cover the entire range from mild to profound losses had to include flat and sloping losses. The new standard audiograms and how they were developed will be explained in detail in a subsequent article.
The last part of the project was of course to define the measurement method itself. When looking at a spectrogram of human speech it is clear that the speech signal varies in several dimensions: time, frequency and intensity at a rapid pace. It therefore seems reasonable to suggest a measurement method that looks at the fine-structure of the signal in contrast to averaging over longer intervals. The time constants of compressors can be quite long compared to the duration of single components of speech. This means that the hearing aid amplifier has a kind of memory in the sense that the amplification of a particular speech component will depend on what went on in the same frequency range in the immediate past.
The Percentile method
The suggested analysis of the hearing aid performance follows the scheme that was proposed by Claus Elberling in 1994 at the Lake Arrowhead meeting: A speech signal is applied as test signal to the hearing aid and simultaneous recordings of input and output are made. A statistical analysis where the actual gain for small signal segments is then performed recognizing that non-linear systems with time constants inevitably will exhibit amplification values depending on the past signal levels and durations.
The suggested analysis of the hearing aid performance follows the scheme that was proposed by Claus Elberling in 1994 at the Lake Arrowhead meeting: A speech signal is applied as test signal to the hearing aid and simultaneous recordings of input and output are made. A statistical analysis where the actual gain for small signal segments is then performed recognizing that non-linear systems with time constants inevitably will exhibit amplification values depending on the past signal levels and durations.
In order to create the necessary data for a statistical analysis the hearing aid must be excited over a period of time long enough to create sufficient data. It must also be recognized that many hearing aids adapt to the signals in a period of time after they have been activated. In this case it was suggested to apply 60 seconds of speech to the hearing aid and use the last 45 seconds as the data for analysis thus leaving a 15 second adaption period.
Signals are analyzed in 1/3 Octave bands with center frequencies from 250Hz to 6,3 kHz thus covering the frequency range from 200 Hz to over 7 kHz. The signals in each frequency band are analyzed in time windows of 125 msec. With a measurement time of 45 seconds it means that 360 gain values are found in each frequency band. Gain is defined as the difference between output and input for the same signal segment.
In order to get accurate gain values, i.e. to identify the output related to a given input signal component, the delay between the two must be compensated for. The sum of the processing delay and propagation time in the acoustic system of the device is therefore calculated. This delay is typically is less than 10 msec. and is compensated for before input and output values can be compared. This is shown in figure 1.

A scatter plot can be made to illustrate the processing behavior in a frequency band. This scatter plot is only shown to increase the understanding of the method as such. It is not a result that is normally provided. It very clearly shows that an input level can be amplified differently every time it occurs. Particularly the low level sound components vary a lot Figure 2 shows an example of such a scatter plot.

Now the percentile analysis that has given name to the measurement method is conducted. A percentile is a way to characterize statistical data. If a variable can assume random values over time one can count the number of times a value falls in a given interval. The 30th percentile is then the value which 30 % of the observations are below. The 99th percentile is the value that 99 % of the values are below which is another way of describing the maximum value in the set. Only 1 % of observations are over the 99th percentile level. For a variable with an even distribution of values the 50th percentile will be the same as the signal average, but this only holds true if the distribution of observations are symmetrical around the average.
The input signal is analyzed frame by frame creating tables of level vs. occurrence. The 30 %, the 65 % and the 99% percentiles are used to represent the lowest level, the mid level and the peak level speech sounds. It is of course possible to calculate and present other percentiles, but in order to keep complexity down the three levels mentioned were chosen. The peak level represented by the 99 % percentile is natural to show how the peak levels of speech are processed. Various analyses have shown that the signals below the 30 % percentile are mostly noise and not very important to speech intelligibility. The 30 % percentile therefore represents the lowest speech levels of importance. The 65% percentile is in the middle between the two other levels representing the median value of the important speech sounds.
The time slots where the levels are within +/- 3 dB of a given percentile are identified. The signal levels in the corresponding output timeslots are found and the input level subtracted to achieve the gain values. These gain values will vary depending on the type of signal processing applied by the hearing aid. This process is illustrated in figure 3.

Another way of illustrating the gain determination can be made using the scatter plot of figure 2. In fig 4, the +/- 3dB intervals around the 30 %, 65 % and 99 % percentiles have been drawn and the average level in each segment has been indicated by the horizontal lines. The gain for each percentile can then be calculated as the difference between the center value of the input and the average output in that segment. The gain values are +6 dB for the 30 %, +4 dB for 65 % and 3 dB for 99 % percentiles.

Fig 4 Illustration of the percentile based gain measurement method. +/- 3dB intervals around the 30 %, 65 % and 99 % percentiles have been drawn.
The outcome of this process is recorded for each of the 19 frequency bands for each of the three percentiles chosen: 30 %, 65 % and 99 %. The Long Term Average Speech Spectrum (LTASS) gain is also calculated. The LTASS is the average level in each band over the entire measurement time. The result of a measurement can now be shown in a traditional frequency intensity diagram. Figure 5 shows an example of such a measurement. As can be seen from figure 5, the highest gain is achieved at the 30th percentile. This makes sense for a typical compressor that compensates for sensory-neural hearing losses where low level sounds are amplified more that high level sounds. The 30th percentile marks the level where 30 % of the sounds are below. The red curve is the gain for the 99th percentile which is the peak levels. Here we see that the amplification is lower which again is consistent with the intended function of typical hearing aid compressors. In between we have the median value represented by the 65th percentile.

Fig 4 Example of a percentile based gain measurement.
Looking across frequency we observe that the percentile curves merge below 1 kHz. This could be because the hearing aid has linear gain in the frequency bands below 1 kHz and there is no difference between the amplification of low and high level sounds. It could also be because very long time constants were chosen for the compressor below 1 kHz.
As can be seen from this example the percentile method offers new insight into the behavior of the sophisticated amplification systems of modern hearing aids. A later article in this series will go in more depth with this new measurement method, the results it provide and how to interpret the new information.
Completing the project
The ISMADHA project comprised 3 distinctly different efforts that all had to be completed before a new international measurement standard could be proposed:
· A new speech test signal
· A set of standard audiograms
· A new measurement procedure
Several subgroups were formed to cover each of the three efforts. The task of developing the speech test signal was after some initial searching assigned to the Hörtech Institute in Oldenburg.
The standard audiograms were developed by a group of Nordic researchers based on some initial experiments with the concept of standard audiograms. The measurement method itself was developed by a group of signal processing experts mostly from hearing aid manufacturers. In order to keep this large and complex project on track EHIMA hired a project manager, Marcel Vlaming that had a long track record in the field of hearing aids.
In the years to follow the project group made it a priority to disseminate information about the project to all relevant parties and to keep in close contact with the standardization bodies that later on should convert the project into an international standard. In April of 2007 good progress had been made on all three subprojects and a laboratory system that implemented the method was ready to be used for a Round robin test among the parties. The testing showed that we were on the right track and the method was documented in a format suitable for standardization.
On the 15th of February of 2008 the document was submitted to IEC TC29/WG 13 that handles hearing aid testing. The IEC standardization process runs in several stages over some years and in September of 2011 the Project manager could happily report that IEC had unanimously approved the standard as:
IEC 118-15: CDV 60118-15 "Electroacoustics – Hearing aids – Part 15: Methods for characterising signal processing in hearing aids with a speech-like signal".
The final document will be available from IEC early 2012.
This article is the first in a series of 4 articles. The next articles will go into detail on the three main elements of the standard: the test signal, the standard audiograms and the measurement method.
- 上一篇:耳内、耳道型助听器的工作原理
- 下一篇:助听器的工作原理详解 电路图直观呈现